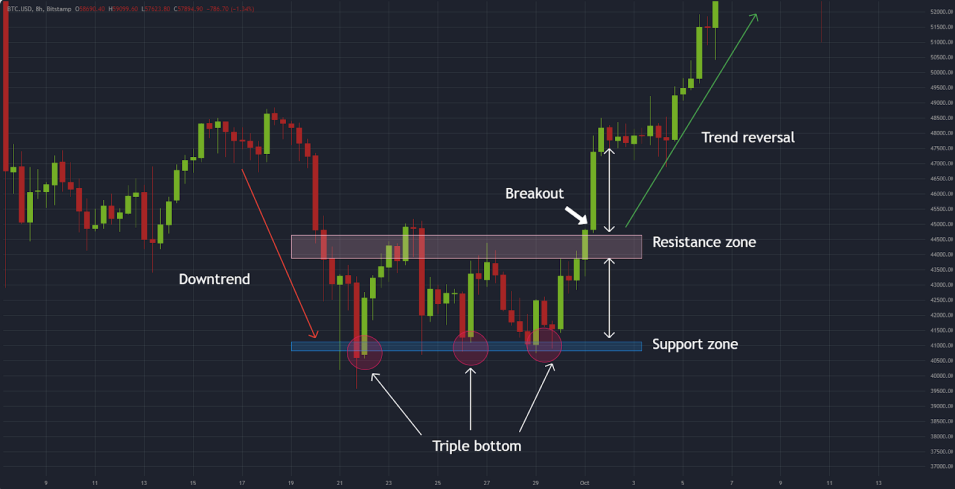
In the chart above, we can see the price following a downtrend and finding support. The price tests this support 2 more times, forming the double bottom chart pattern. Actually, in our case, it’s a triple bottom, which works exactly like the double bottom pattern. A significant bounce allows the price to break out of the resistance and reverse the trend. The first take profit target should be of the same height as the distance between the support and resistance.
Just like with the double top, the double bottom price target is provided by the distance of the support and resistance zones.